Market Dynamics in Election Years: Lessons from History and Recent Events

As we approach the 2024 U.S. Presidential election, the markets have already shown signs of reacting to the evolving political landscape. This is not uncommon as elections have historically impacted market behavior.
Let’s explore historical patterns from past election cycles, integrate a behavioral perspective on investing during election periods, and discuss the recent shifts in market sentiment.
Historical Patterns
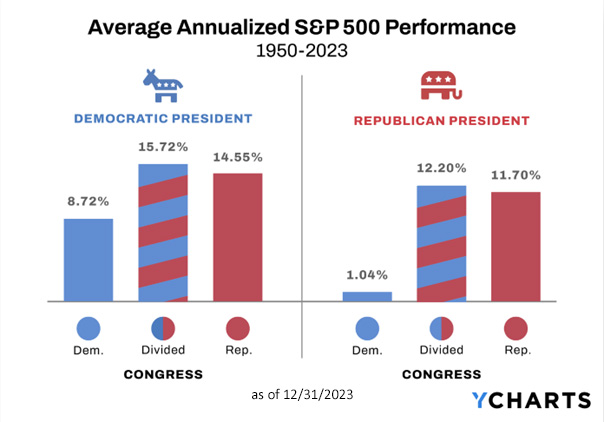
U.S. Presidential elections have traditionally been a significant source of market volatility. The S&P 500’s performance during election years has varied depending on which party is in power, but on average, the market tends to perform better under a Democratic presidency, when Congress is divided, as shown in Chart 1. This suggests that markets appreciate the checks and balances a split Congress provides, which tends to prevent extreme policy shifts.
Chart 1 – The Power of Balance: One Thing We Can All Agree On
Behavioral Insights on Investing During an Election
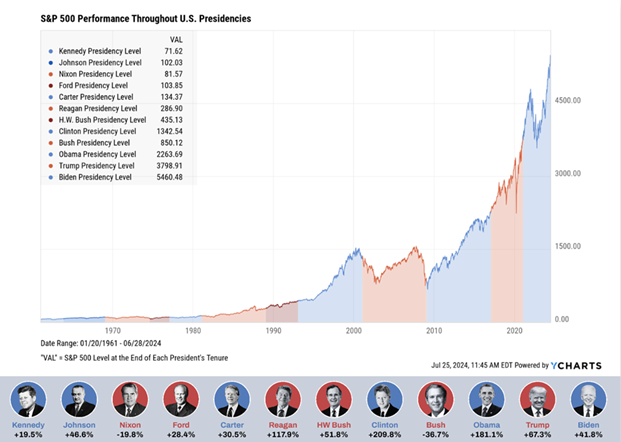
Investors often overestimate the impact of election outcomes on their portfolios. The fear of policy changes or economic instability can lead to rash decisions, such as moving to cash or drastically altering asset allocations. However, history suggests that staying invested and diversified is the best course of action. As seen in chart 2, markets have generally done well over the long term.
Chart 2 – Market Resilience: Investing for the Long-Run Through Presidential Changes
A common pitfall is the so-called “election trade,” where investors try to anticipate the market reaction to a candidate’s victory. For instance, the initial reaction to Trump’s rising odds after the Biden-Trump debate contributed to a rotation from growth to value stocks and Mega caps to small caps. This was driven in part by the expectation that Trump’s policies could cause higher long-term bond yields and a shift in fiscal policies favoring traditional industries. However, as the political landscape shifted with President Biden dropping out and Harris’ chances increasing, the initial “Trump trade” appears to have unwound.
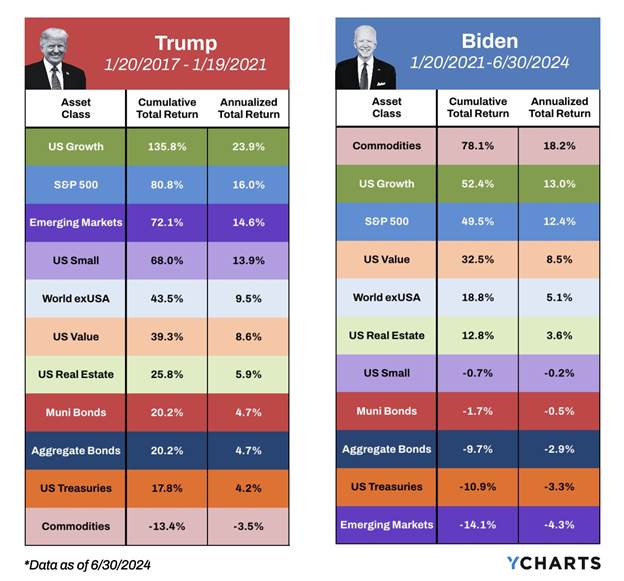
As Chart 3 highlights, markets are complex and react to a multitude of factors beyond which party occupies the White House. Investors who attempt to time the market based on election outcomes often miss potential gains, or worse, incur unnecessary losses.
Chart 3 – From Trump to Biden: A Heatmap of Market Shifts
The 2024 Race: A Toss-Up with Market Implications
The 2024 presidential race is currently a toss-up, with Trump and Harris holding roughly equal odds of winning according to popular forecasting sources. At this juncture, a divided Congress appears the most likely outcome. This potential for a split government could be a stabilizing factor for markets, preventing extreme policy measures from either side.
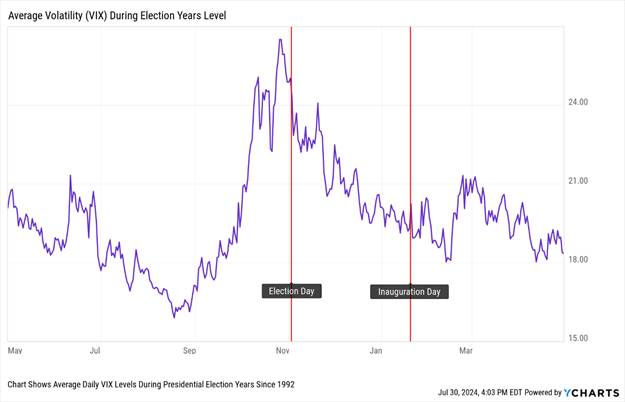
Regardless of who wins, the U.S. fiscal deficit will continue to be a challenge. With Medicare, Social Security, and interest expenses expected to rise, the deficit is likely to remain elevated even without additional spending or tax cuts. Interestingly, the market’s long-term performance has not been significantly impacted by deficits, however. As seen in Chart 4, short-term volatility around elections can create opportunities for those who remain disciplined and focused on long-term investment goals.
Chart 4 – Market Jitters: Volatility Climbs Ahead of Election Day
While elections can influence market behavior in the short term, the best strategy for investors is to maintain a long-term perspective and avoid knee-jerk reactions based on political developments. The data supports this approach, showing that markets have generally performed well over time, regardless of which party holds power.1 As we move closer to the 2024 election, staying informed and avoiding the temptation to time the market will be key to navigating this period successfully.
1 Investing Based on Preferred Political Party (Growth of 10,2000), 1960-2024, YCharts
This communication is provided by Bryn Mawr Capital Management (“BMCM” or “Firm”) for informational purposes only. Investing involves the risk of loss and investors should be prepared to bear potential losses. Past performance may not be indicative of future results and may have been impacted by events and economic conditions that will not prevail in the future. No portion of this commentary is to be construed as a solicitation to buy or sell a security or the provision of personalized investment, tax or legal advice. Certain information contained in this report is derived from sources that BMCM believes to be reliable; however, the Firm does not guarantee the accuracy or timeliness of such information and assumes no liability for any resulting damages.
Bryn Mawr Capital Management, LLC. is an SEC registered investment adviser and a subsidiary of WSFS Financial Corporation. Registration as an investment adviser does not imply a certain level of skill or training.
INVESTMENTS: NOT A DEPOSIT. NOT FDIC – INSURED. NOT INSURED BY ANY FEDERAL GOVERNMENT AGENCY. NOT GUARANTEED BY THE BANK. MAY GO DOWN IN VALUE.

